DSS300-HR
DSS300-HR can be used for multiple purposes as well as a 3-axis Force Sensor.
Calculates industrial values of sensor signals, and data can be monitored in real-time.
Digital filtering through the software enables analog noise reduction and monitoring of physical values.
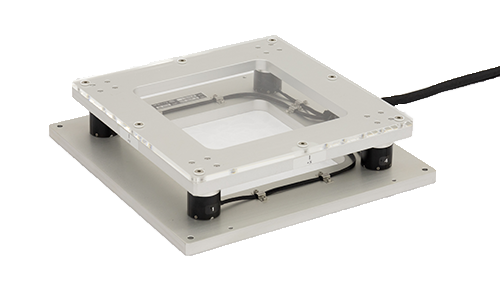
- Real-time measurement, monitoring physical quantities (N) of 3-axis force sensors.
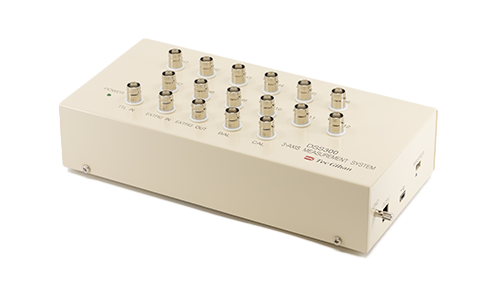
- Max. five 3-axis sensors can be used per unit. Max. 21 sensors can be measured simultaneously by cascading the terminal boxes.
- Data are saved in CSV format.
- Digital low-pass filter (-24dB/oct) without phase delay allows analog noise reduction.
- Can be used for other devices such as strain gauge sensors.
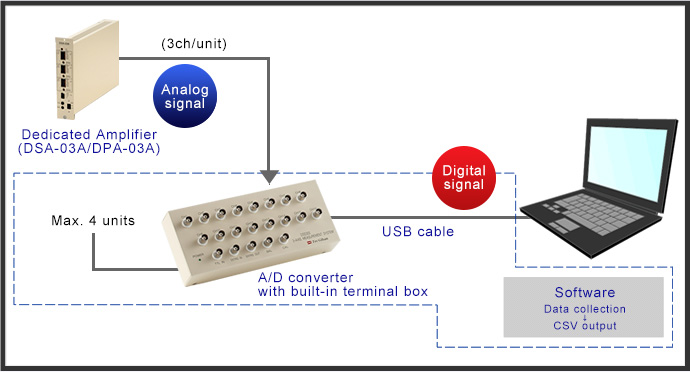
System Configuration
Software
Preparations
1. Sensor information settings
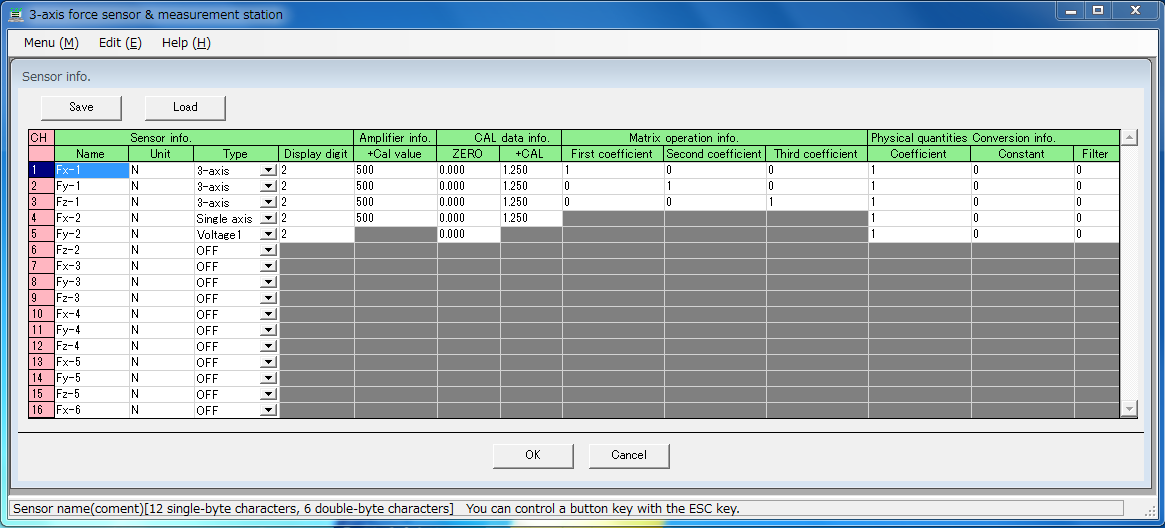 Enter the applied sensor information.
Digital filtering settings can be done with this window
(-24dB/oct low-pass filter without phase delay).
2. Calibration
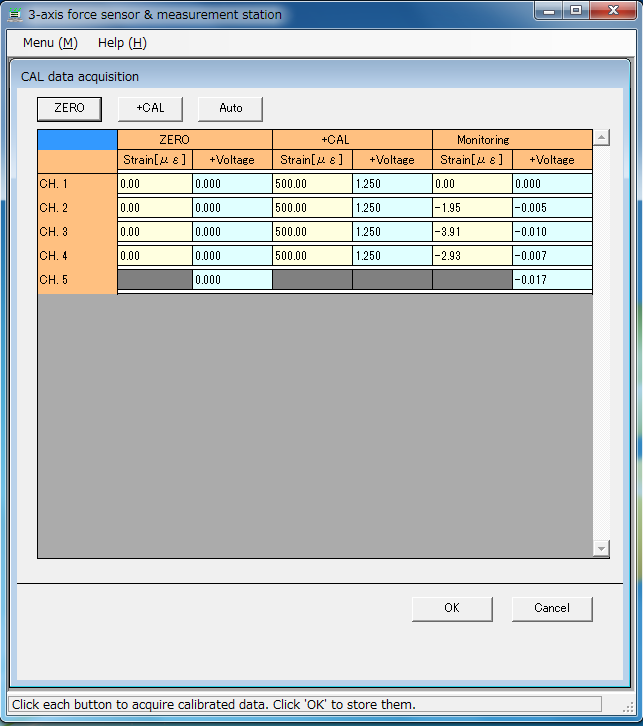 Performs the calibration of a sensor and an amplifier.
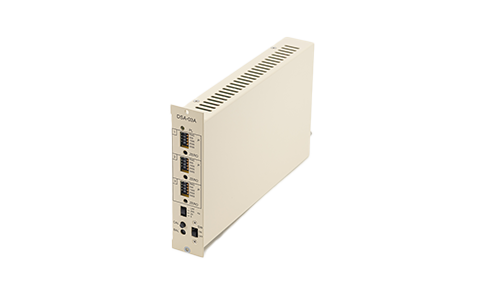
※ DSA-03A amplifier: BAL (zeroing) and CAL (calibration) must be performed with this window.
※ DPA-03A amplifier: This window is not available.
3. Test condition settings
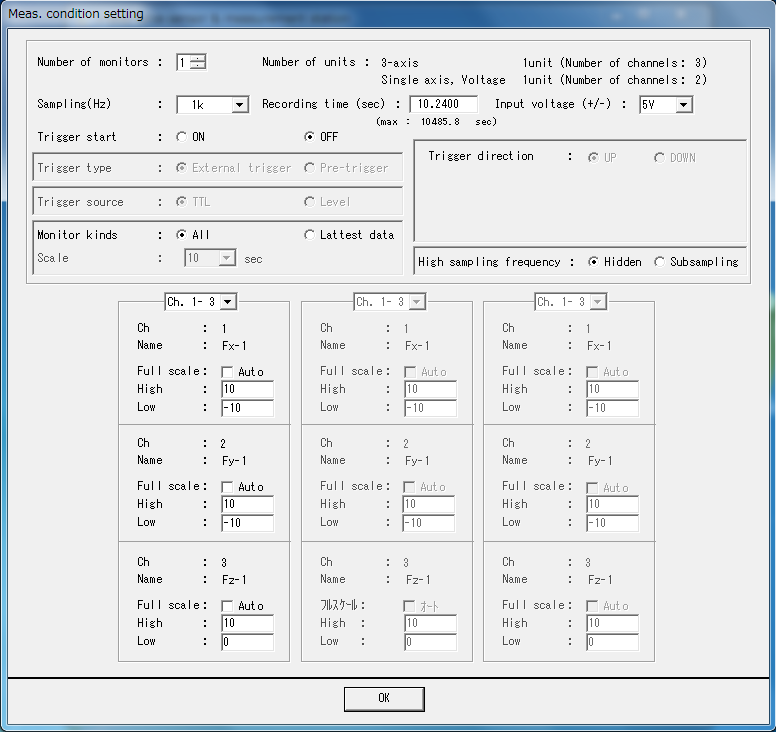 Enter sampling frequency, measurement time, trigger and graph monitor settings.
Measurement (Data save)
1. Measurement
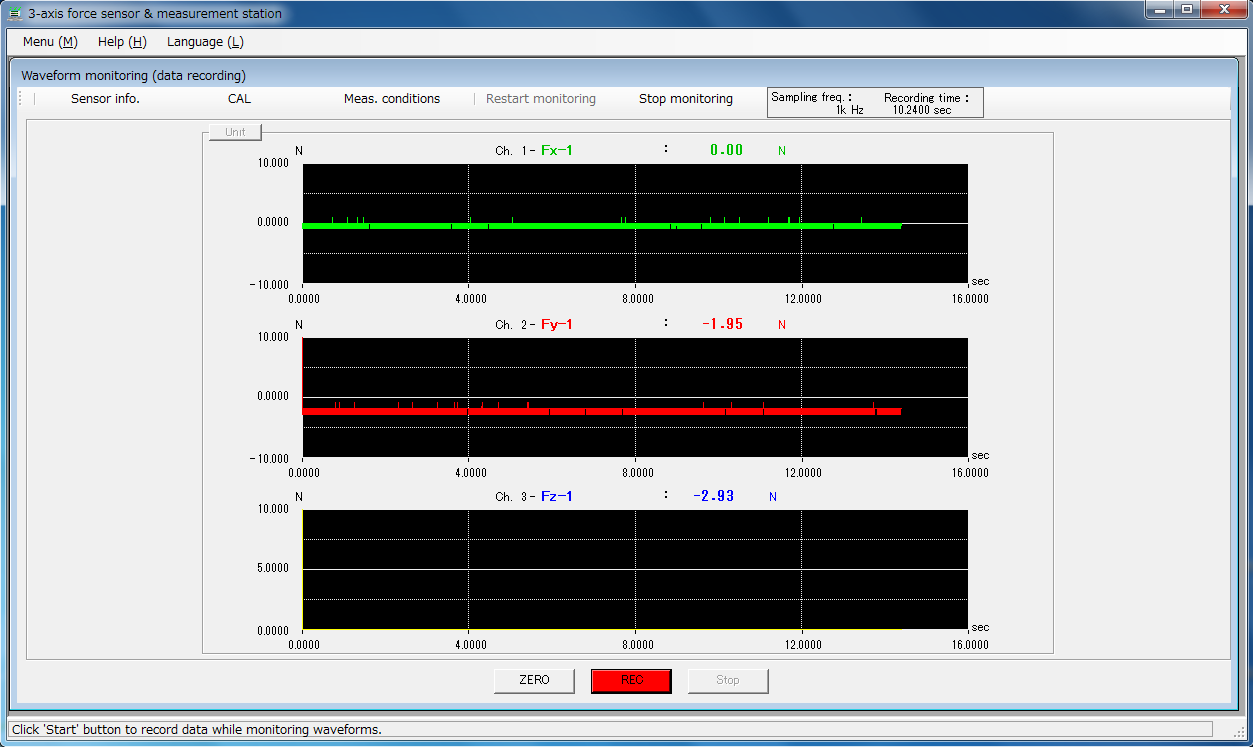 Monitors sensor outputs in real-time based on the settings.
Can also record measurement results.
2. Data check
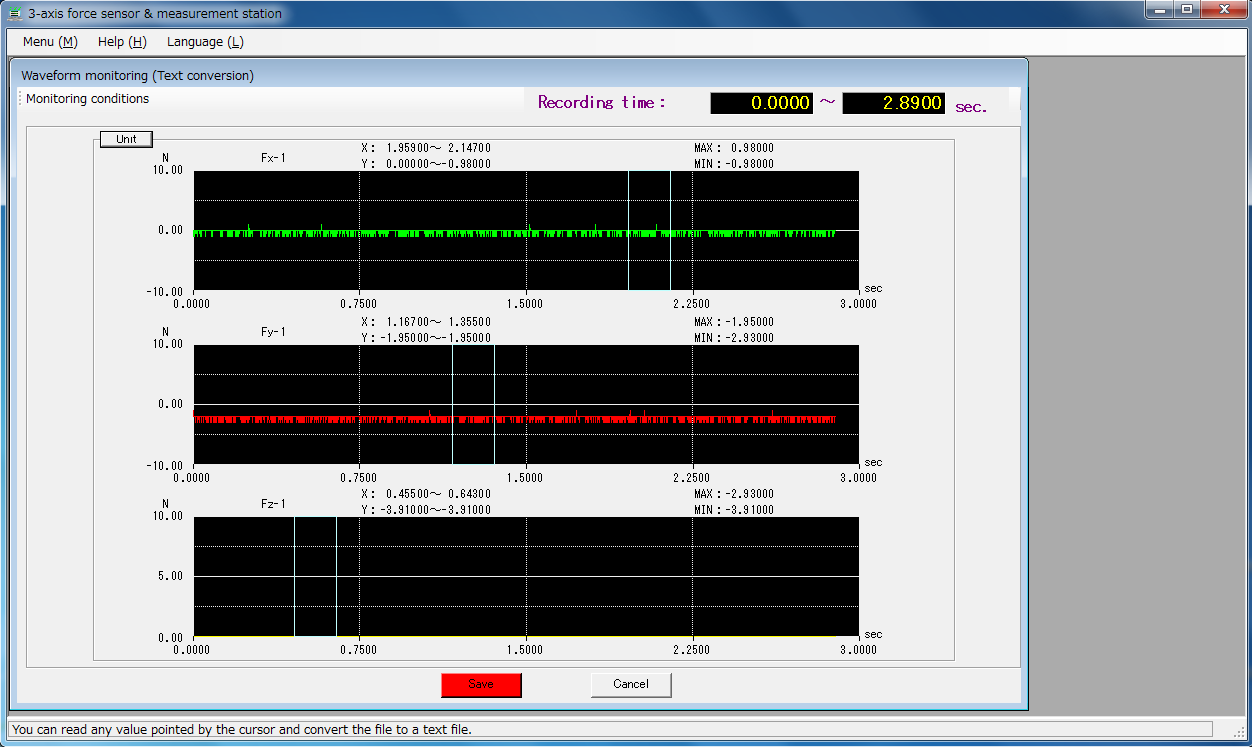 A value pointed with a cursor can be read.
Data can be saved in CSV format.
3. Data save (CSV)
Options
Chronological waveform monitor
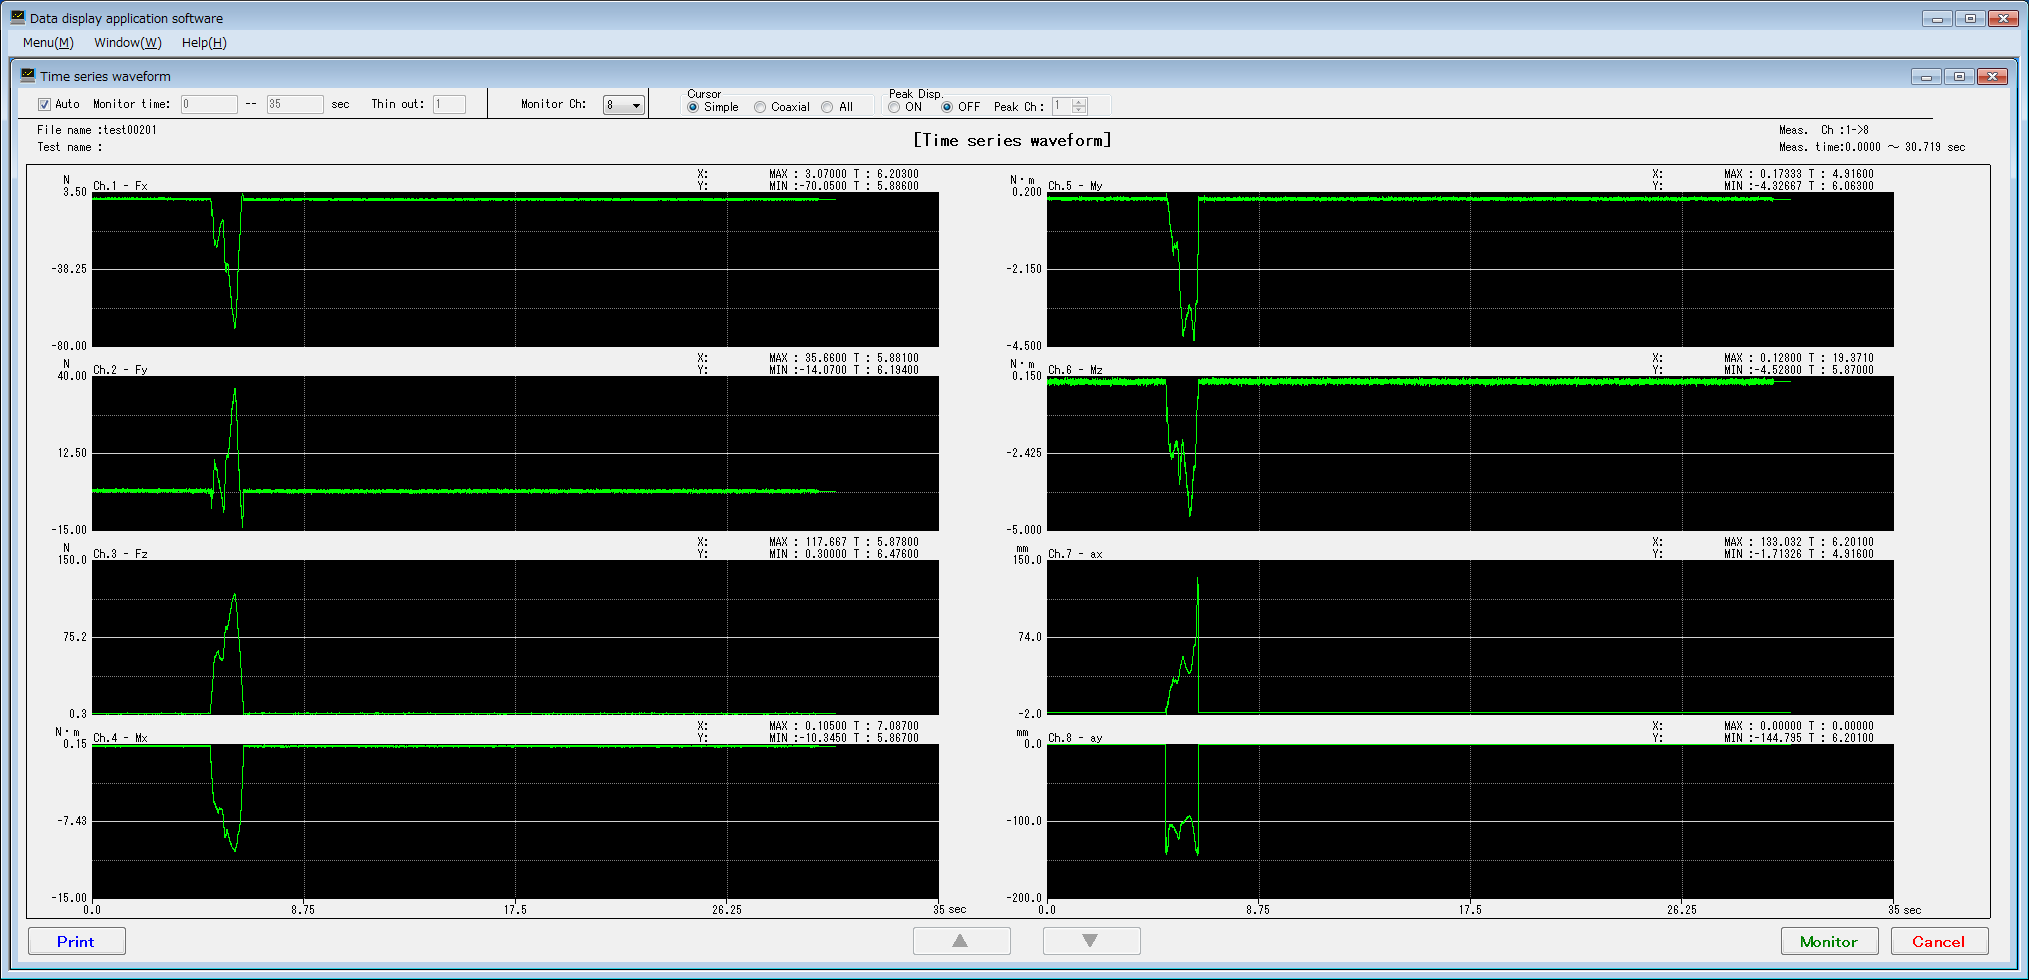 Shows chronological graphs of specified channels (X-axis: Time, Y-axis: Industrial value).
Monitored data can be read using a cursor and peak or average values of specified period can be easily monitored.
Chronological overlaid waveforms
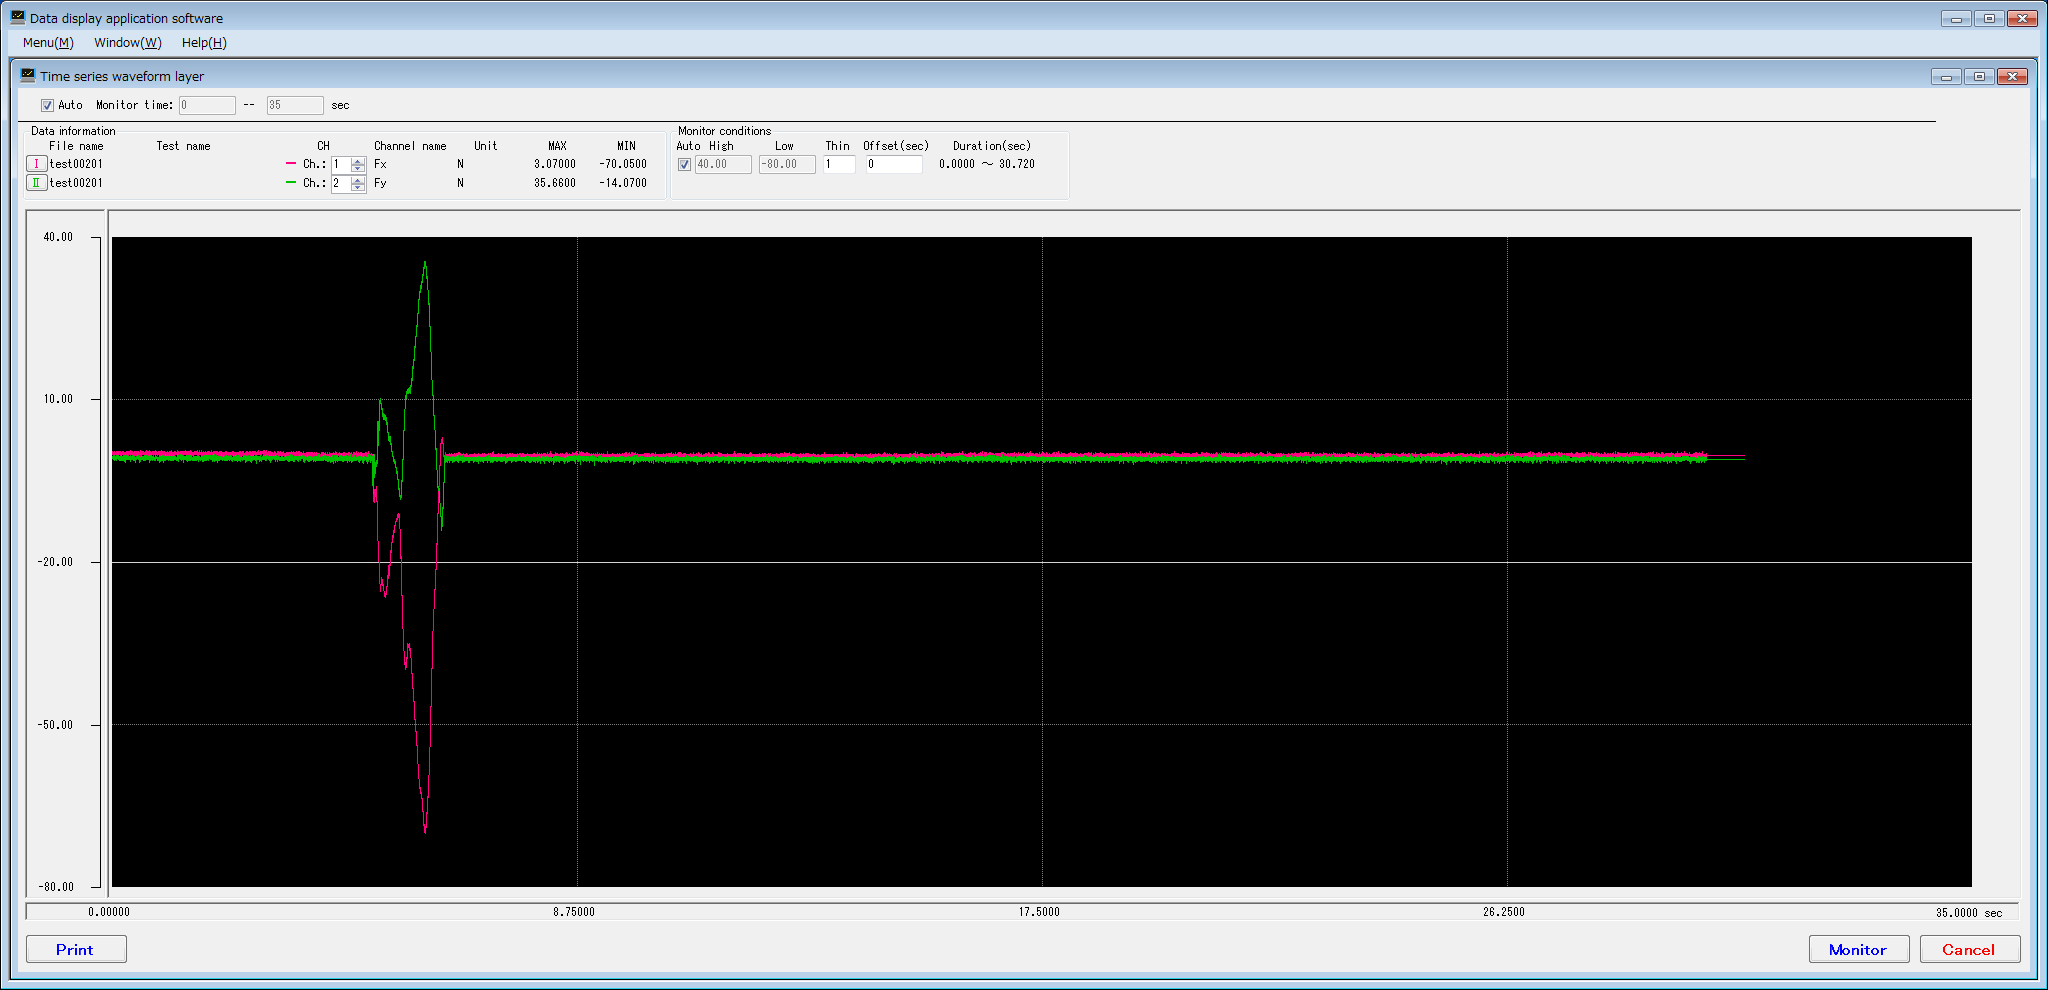 Shows overlaid waveforms of specified channels from maximum 6 data files. (Cursor-data-reading is not applicable.)
Correlation graph monitor
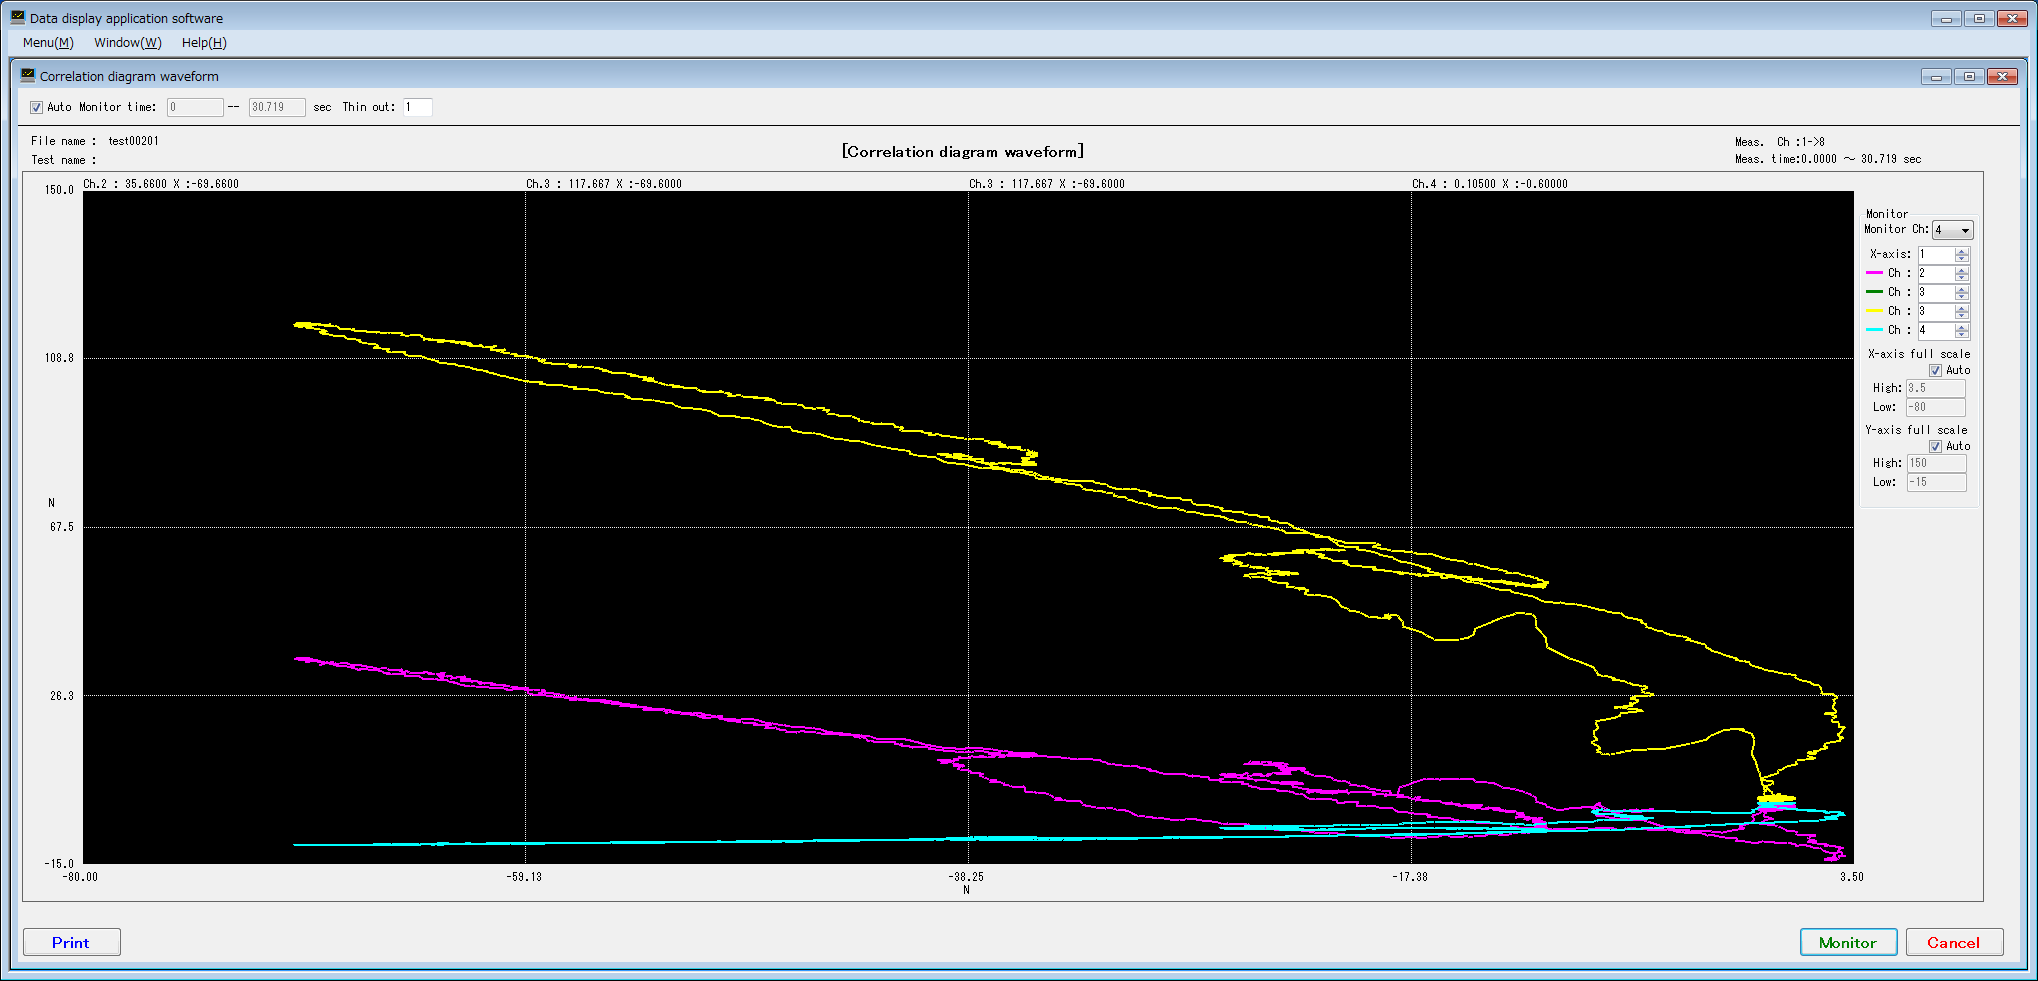 Displays the correlation chart of specified channels from a data file (X-axis: Industrial value, Y-axis: Industrial value).
(Cursor-data-reading is not applicable.)
Statistics
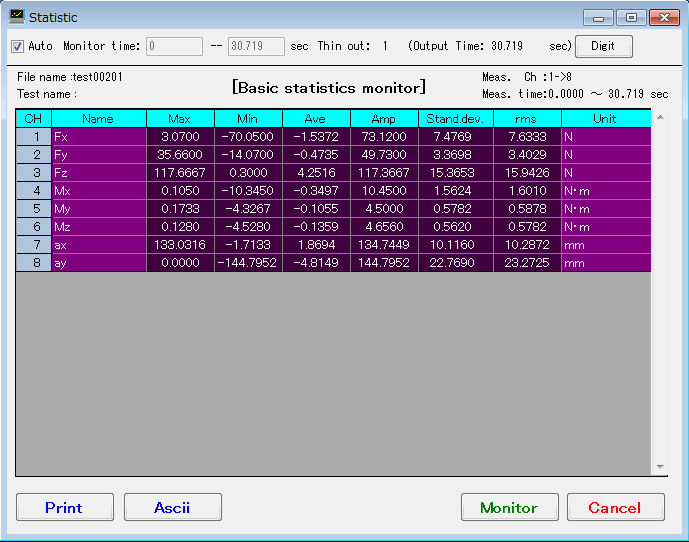 Shows ‘Max. value’, ‘Min. value’, ‘Average’, ‘Amplitude value’, ‘Standard deviation’ and ‘rms’ of a data file.
Specifications
| Model | DSS300-HR |
|---|---|
| [Performance] | |
| OS Compatibility | WindowsXp , Windows7 |
| Number of channels | 16CH/unit (Max.4 units (64CH) can be cascaded) |
| Resolution | 12-bit |
| Input range | ±1V, ±5V, ±10V (Switchable using the software) |
| Conversion accuracy | ±0.2%FS |
| Sampling frequency | Max.100kHz/CH (Max.5kHz/CH for 17th CH or above) *May be restricted according to processing speed of a computer. |
| Data capacity | Depends on an available memory of a computer (Max.100MB). |
| Measurement method |
Manual (software), External trigger, Pre-trigger, Level trigger External trigger: Contact or TTL signal *TTL (positive logic) only for 17th CH or above. Pre-trigger: Contact or TTL signal *TTL (positive logic) only for 17th CH or above. Level trigger: Optional 1CH *Available for 1 unit (~16CH) only. |
| Accessories | Measurement software, USB cable (1m) |